Data Visualisation via Dashboarding

Dashboards and simulators help tell critical stories with data, so you can make strategic decisions.
We deliver standard and custom technology platforms that bring together best-in-class design, data and business expertise.
We start from business-led design, solution development aligned with your technology priorities, deployment on the cloud or on your premises, and roll-out support that includes training sessions and video tutorials.
Data sources can include primary research, client data such as media spend, sales, footfalls or transaction data, and secondary data including social media, retail audits and syndicated reports.

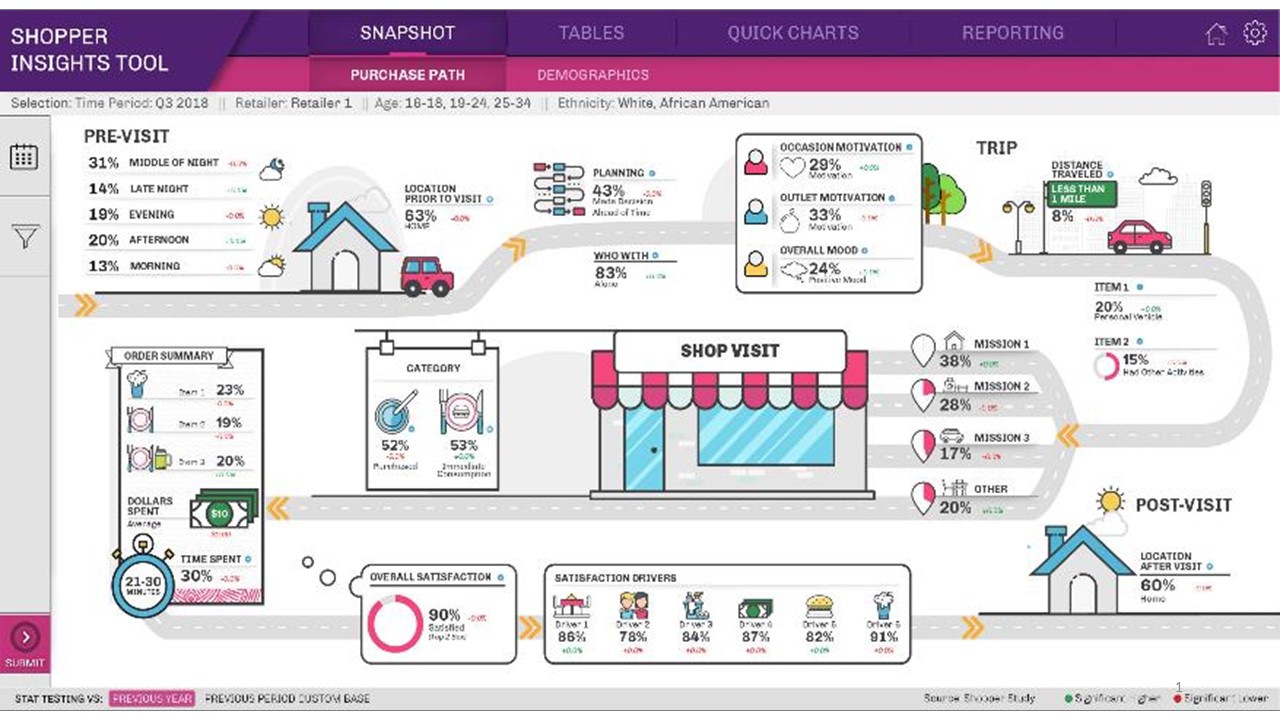
Purchase path snapshot
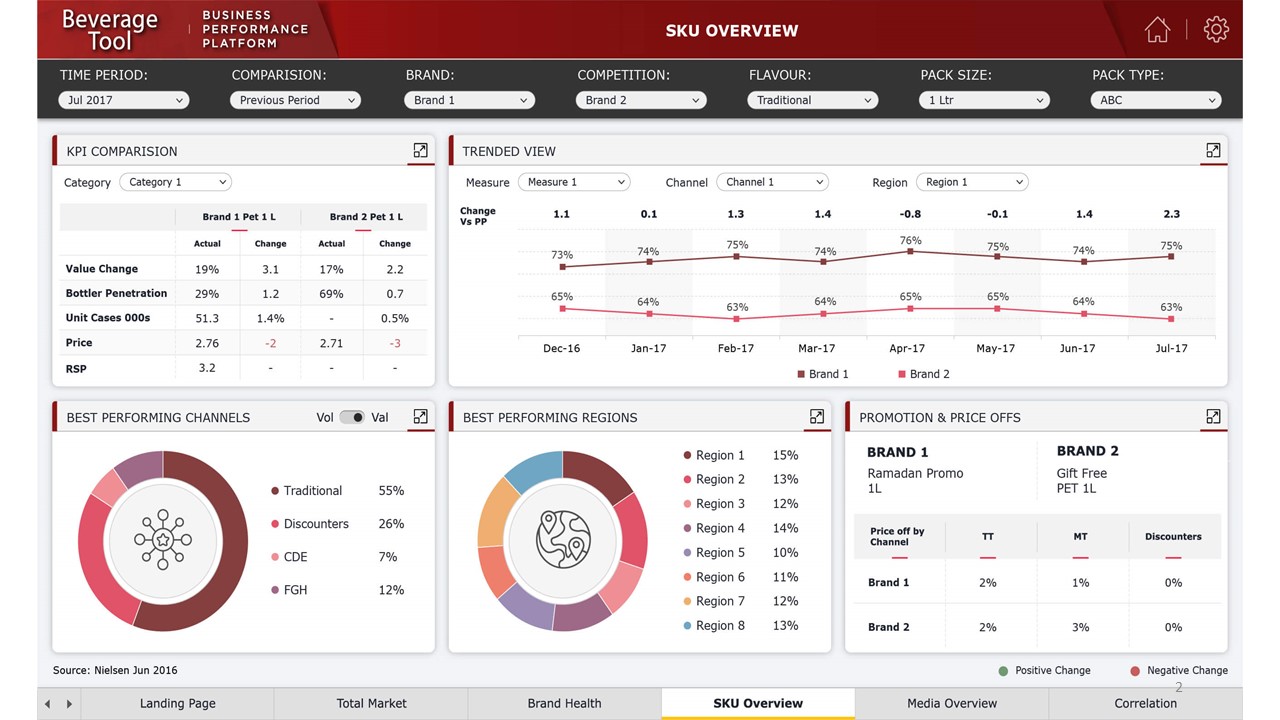
Tracking business performance
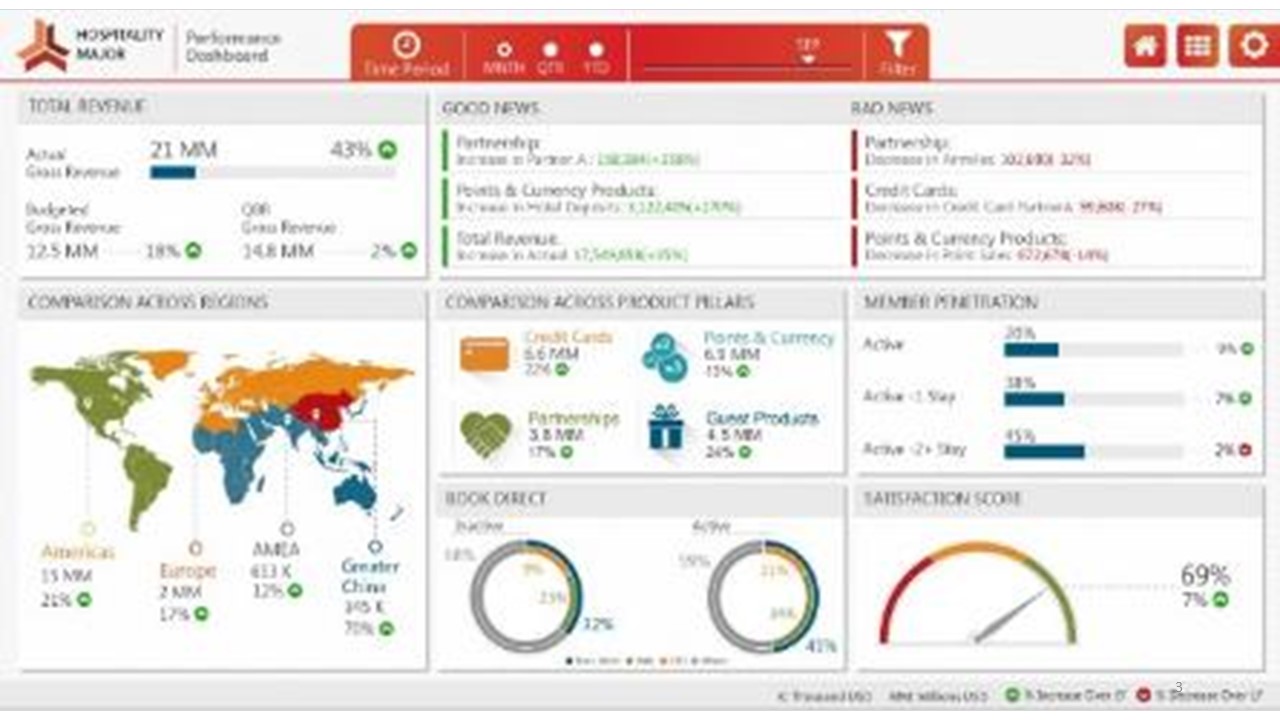
Integrated dashboard
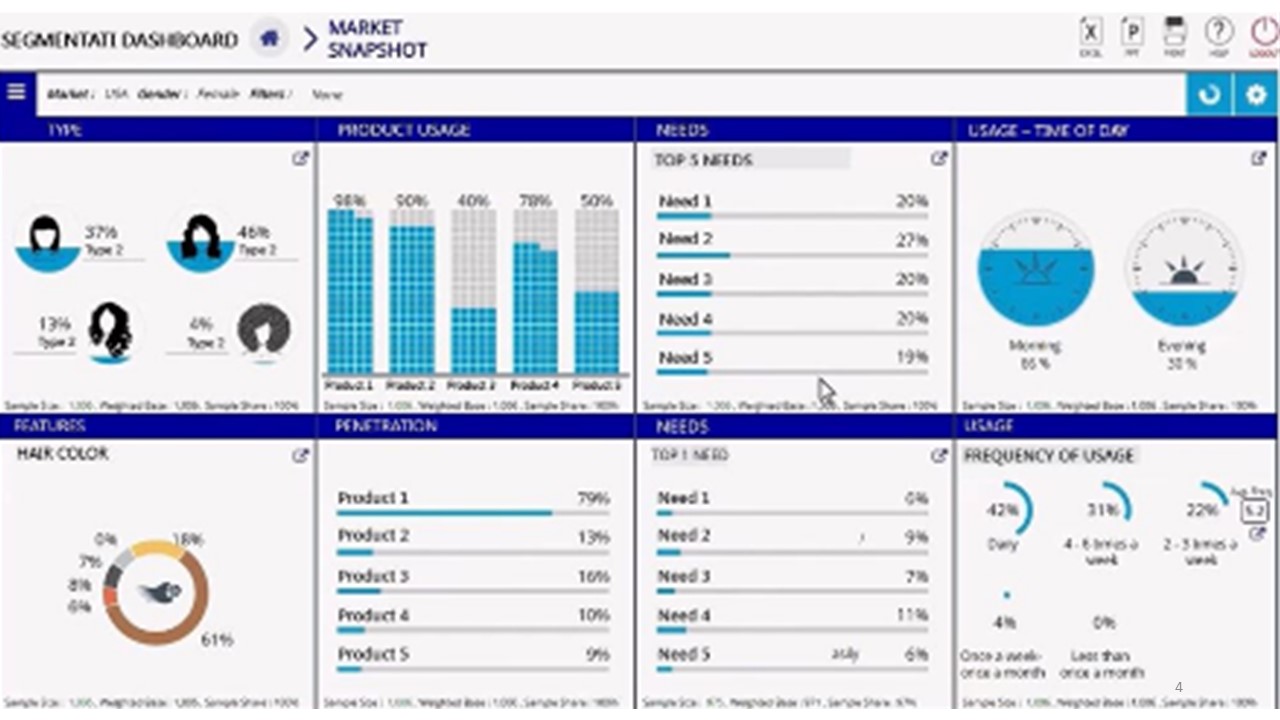
Usage and attitudes
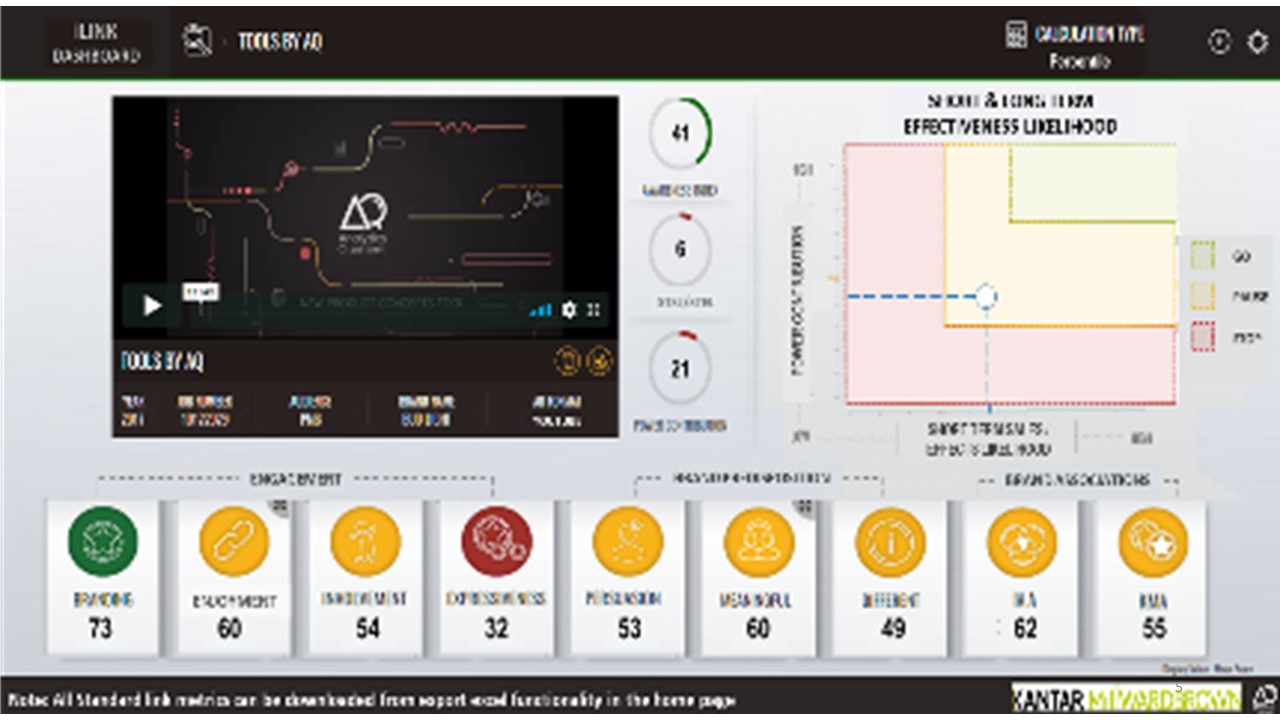
Creative ad effectiveness evaluation
Data visualisation: Unlock the story behind your data
Data visualisation makes data accessible to a large audience by making it easier to comprehend multiple KPIs simultaneously, as well as detect patterns, trends, and outliers in large data sets. This process helps organisations make data-driven decisions faster and more accurately. Bringing data to life is the last mile in the data-to-insights journey.
This whitepaper helps explain the benefits of good data visualisation and provides best practice guidelines.
Ka kite anō au i a koe
Thank you for visiting. Please get in touch to talk to our trusted experts about how our market or social research can help your organisation.
Get in touch
Our Office
Auckland
Level 1/46 Sale Street,
Auckland 1010
T (+64) 9 919 9200
Find us

